In this tutorial, we describe how to access your data on Firebase Analytics once you’ve set Firebase Analytics for your native apps (iOS and/or Android).
Google Analytics collects usage and behavior data for your app. The SDK logs what Google calls Events.
Events: What is happening in your app, such as user actions, system events, or errors.
You can view aggregated statistics about your events in the Firebase Analytics dashboards. These dashboards update periodically throughout the day.
Firebase logs several types of Events. You can view up to 50 Events parameters for free on your Firebase Analytics dashboard. Those parameters can differ depending on your app content.
Find below how to view and access the most common Events parameters of The App Match apps.
1. Analytics data
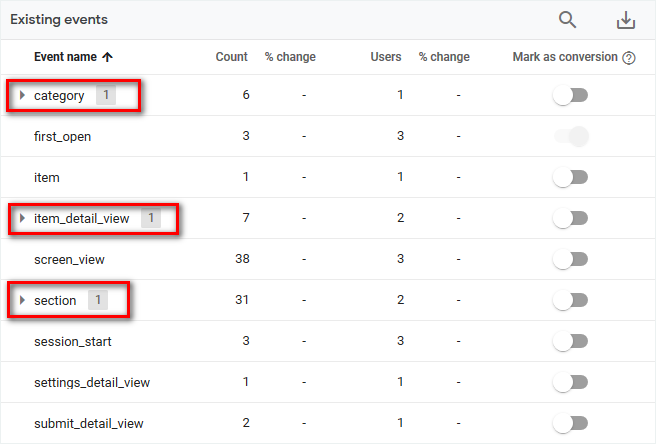
You can access this data from the Events dashboard in the Firebase console. This dashboard shows the event reports that are automatically created for each distinct type of event logged by your app.
Wait for the first reports to appear in your Firebase console*
*You’ll be able to see your first reports within 24 hours of implementing analytics to your native apps.
A. Set up parameter reporting for section event
This allows you to see the titles of your section pages that have been seen by your users.
1. Go to the menu Analytics > Events of Firebase Analytics
2. Click the 3 dots at the end of the line “section”
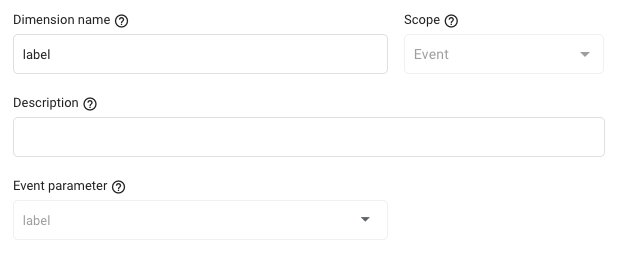
3. Click “Edit parameter reporting”

4. Add the parameter “label”
5. Select the type “Text”
6. Click “Save”
B. Set up parameter reporting for item_detail_view event
This allows you to see the titles of your detail pages that have been seen by your users.
1. Go to the menu Analytics > Events of Firebase Analytics
2. Click the 3 dots at the end of the line “item_detail_view”
3. Click “Edit parameter reporting”
4. Add the parameter “label”
5. Select the type “Text”
6. Click “Save”

C. Set up parameter reporting for category event
This allows you to see the titles of your category pages that have been seen by your users (this event is useful only if you set categories for your content).
1. Go to the menu Analytics > Events of Firebase Analytics
2. Click the 3 dots at the end of the line “category”
3. Click “Edit parameter reporting”
4. Add the parameter “label”
5. Select the type “Text”
6. Click “Save”

2. Check your Events reports
1. Go to the menu Analytics > Events of Firebase Analytics
2. In the Event name column, click one of the events set for your app to access your data.
3. Filter control by Platform: Android or iOS
1. Click Add Filter + to focus on a subset of data.
Your filter stays active as you move through reports.
4. Date range
1. Click the date range display to select a date range.
Your date range stays active as you switch from one report to another. All reports compare metric values for the date range you choose to metric values from the previous period.
2. Select “Custom” to create a date range beginning and ending on the dates you select.


