The App Match allows you to see the statistics of the use of your app.This data will allow you to better understand the behavior of your users, and they will give you information on the quantity and type of traffic on your application.
Statistics are calculated and updated every 24 hours for the previous day, they are not updated in your back office in real time.
1. Access you statistics
1/ Publish your native app Android and iOS (premium offer only)
2/ Allow a day for your statistics to be calculated
2. Traffic
1/ Go to the menu Audience > Statistics > Traffic
2/ Click the platform tab you wish to check the statistic for.
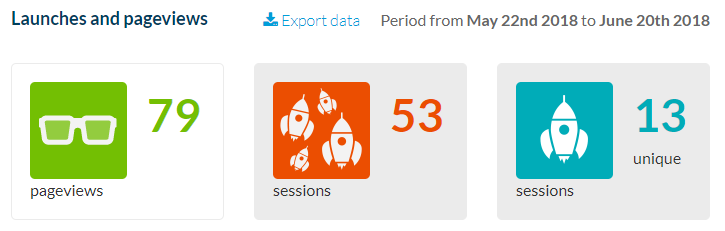
Launches and page views
Every time a user launches your application his action is recorded, as well as the number of pages that the user opens. These statistics can be consulted for a given amount of time, in total or for a given type of device.
Sessions: The total number of launches during a given period of time.
unique sessions: A unique session is logged for all launches by the same user within 24 hours during a given period of time.
For example, if a user launches your application twice a day during a period of time of 7 days, it will count as 14 launches and 7 single launches during the period of time.
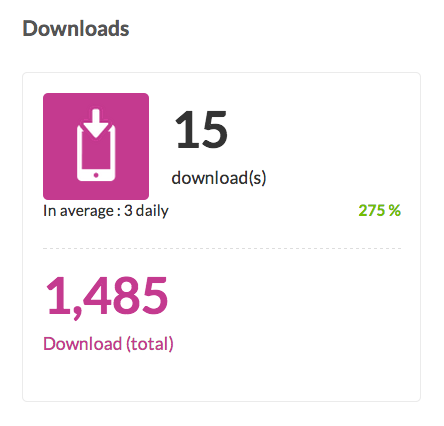
Downloads
The number of downloads stands for the actual number of people who have installed your application and launched it at least once.
Just like the number of launches and page views, this statistic can be consulted either in total or for a certain period.
All downloads are counted: ad hoc versions, apps deleted then installed again by a user etc.
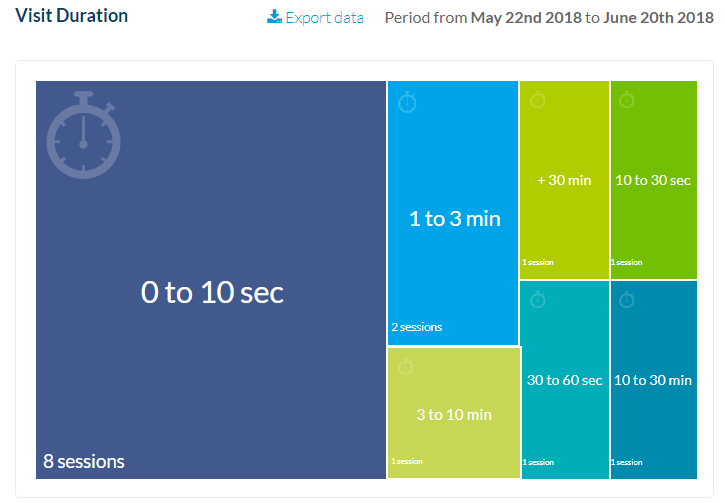
Visit Duration
For each visit duration of your application, the number of connections is logged.
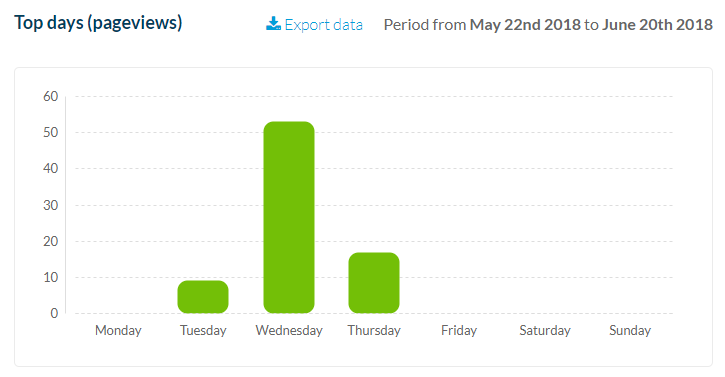
Top days
This statistic totals the number of page views for each day of the week, and allows you to determine whether activity on your app is particularly frequent on certain days of the week.
Please note: This statistic is only available as a total statistic, it can’t be further broken down.
3. Technical
1/ Go to the menu Audience > Statistics > Technical
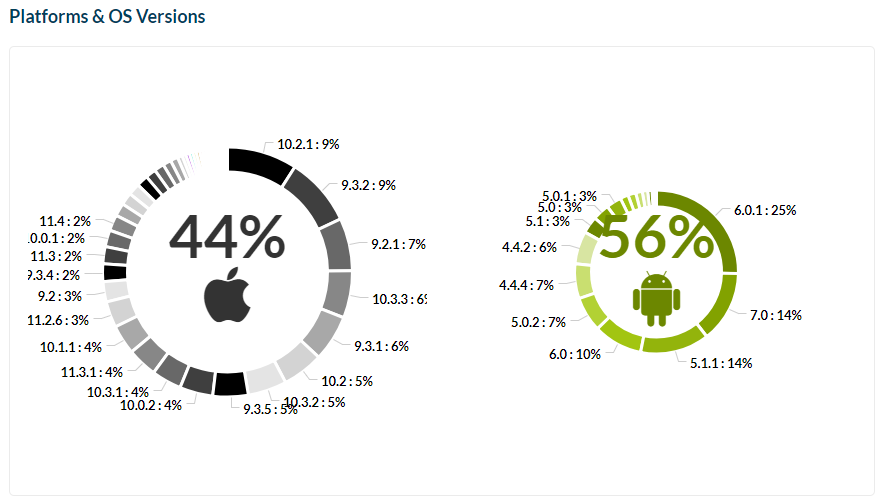
Platforms & OS Versions
Every time your The App Match app is opened, we recognize the device and the operating system used.
The percentage of each category is calculated automatically.
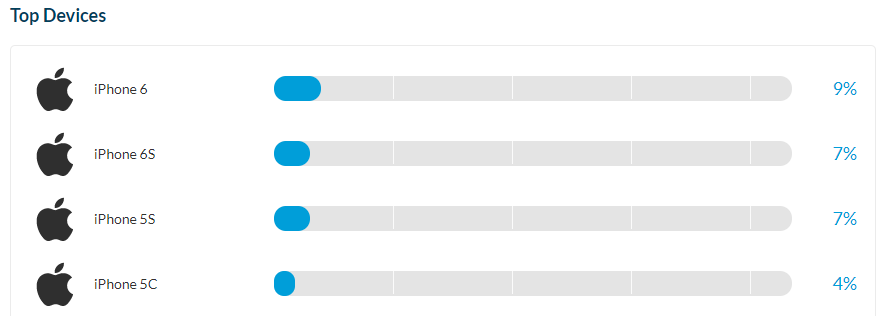
Top Devices
The percentages of the different types of devices used to open your app are categorized by their frequency.
4. Social
1/ Go to the menu Audience > Statistics > Social
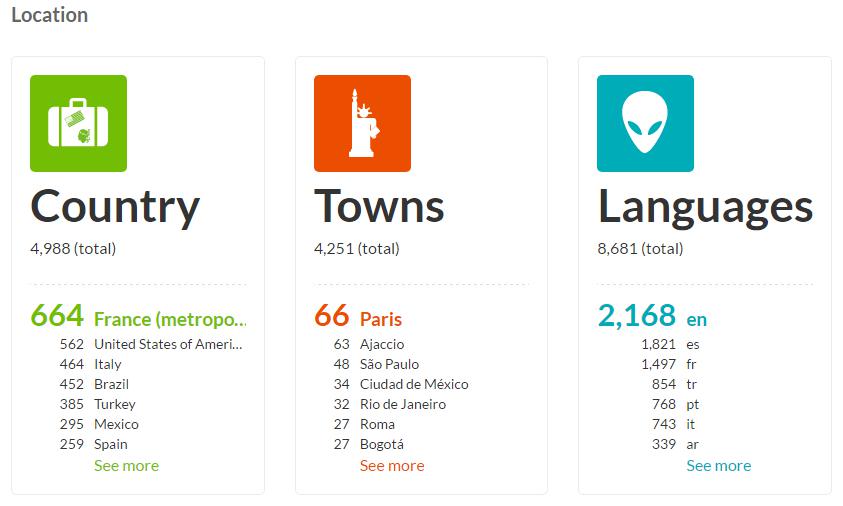
Location
Here, you can see the app installs classified by countries, towns, and the language of the user’s device.
The installs show on the map by density of users.
Please note:
The distribution of your app is managed by the App Store (Apple) and Google Play, not through The App Match.
As a result, and since the distribution doesn’t originate from The App Match, we cannot keep track of the number of times your app is installed or deleted on an iOS or Android device.
The statistics provided in your The App Match back office are provided for information purposes only.
They have no contractual value. They only aim at providing the general trend regarding your user base.


